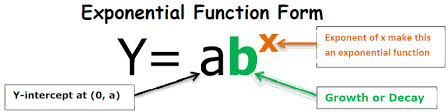
Exponential functions are one-to-one functions whose graphs are asymptotic to the x-axis - gets very close to the x-axis but doesn't touch it or cross it. The base is a number while the variable is in the exponent. It has a constant change in the independent variable with the same proportional change (percentage increase or decrease) in the dependent variable.


Growth and Decay: There are exponential growth and decays, each increasing or decreasing at a constant rate. You can see if a function is a growth or decay by its equation. When b is between 0 and 1, its is decay, when it's greater than 1, it is a growth.
Example: When a > 0 and the b is between 0 and 1, the graph will be decreasing (decaying).
For this example, each time x is increased by 1, y decreases to one half of its previous value.
This is exponential decay.
Example: When a > 0 and the b is greater than 1, the graph will be increasing (growing).
For this example, each time x is increased by 1, y increases by a factor of 2.
This is exponential growth.
Domain and Range: The domain of a general exponential growth function of a base to the exponent x is all real numbers, and the range is y is greater than or equal to 0. It is the same for a general exponential decay function. They both also have a horizontal asymptote at y=0. For more about domain and range, see the section entitled Functions.
Inverse: The inverse of the exponential function is the logarithmic function.

Looking at the graph of an exponential function:
Regression Lines: The regression line is like a line of best fit. Its a graph that most accurately models a set of data. If that data is growing or decaying at a constant rate, you most likely want to find its exponential regression, or the exponential line that models it best. If you do this on your calculator, it will also give you a value for r^2. This is a number that indicates how well the data fits a statistical model. If r^2 equals 0, this means there is no relation between your x-values and your y-values. When r^2 equals 1, that means there is a regression line that perfectly fits your data. Between this, there is a regression line that models your data, but not perfectly. the closer your r^2 value is to 1, the better the regression line fits the data. Different kinds of regressions lines will fit different kinds of data better or worse. Exponential regressions should be used for only certain kinds of data.

Word Problems: Often times in word problems, you can take different approaches to the same problem. This can also depend on whether you have access to a calculator or not. If you have been given data in a word problem, you can find the regression line using a calculator, or make an equation using your data, or other things depending on what the problem is asking you to find. Most of the time, having an equation for your data is very helpful.
F(m)=150⋅e^0.4m
Sarah Swift got a speeding ticket on her way home from work. If she pays her fine now, there will be no added penalty. If she delays her payment, then a penalty will be assessed according to her delay in paying the fine. Her total fine, F, (in dollars) as a function of a delay of, m, months is modeled by the function above.How long can Sarah delay her payment before the fine reaches $600? Round your answer, if necessary, to 2 decimal places.
When looking at this problem, there are different ways to approach it. Lets look at it algebraically, and deal with the function we've been given. First, know what we are trying to find in this problem. We want to know the value of m when the function equals 600, or the amount of time she has before her fine reaches $600. So we should set the function equal to 600 and solve for m.
600/150 =150/150 x e^0.4m
ln4= lne^0.4m When we take the natural log of each side, the exponent goes down and the natural log of e is 1.
ln4=0.4m
1.386/0.4=.04m/0.4
3.47=m
Now we know that after 3.47 months, the fine reaches $600.
We could also have looked at the graph of this function and traced it. Different people prefer looking at problems in different ways.
This next video shows a very similar problem using the same circumstances, but asking for different information.
Ayaka is going on a long, all-day hike with friends at Yellowstone National Park. She drinks lots of water while she hikes. Some of the amounts, W, of water in milliliters remaining in her drinking bottle t hours after starting the hike are indicated in the table below. These numbers represent an exponential function.
t Amount W(t) of water
1 4500
2 4050
3 3645
4 3280.5
What is the common ratio of consecutive values of W?
To find the common ratio of consecutive values, all you need to do is to look at what is being multiplied to the values to get each one. To be clearer, 4050 divided by 4500 is .9. So is 3645 divided by 4050 and 3280.5 divided by 3645. This means that .9 is the common ratio.
What was the initial amount of water in milliliters in Ayaka's drinking bottle?
This is information you can obtain a number of ways. Again, you could just look at this function's graph, or its regression, trying to find W(0), but we will use the common ratio. Because each number is being multiplied by .9, we just have to find what was first multiplied by .9 to get the amount of water after the first hour. If we say that the initial value is I, we can set this up as I x .9 = 4500. When you solve for I, you get that the initial value is 5000.
Write a formula for this function.
To find a formula for this function you could always plug the information into a calculator, but lets use the formula W(t)=ab^t. First we plug in the initial value for a, which is 5000. Then, we plug in the rate for b, which is .9. Now we have our formula
W(t)=(5000)(.9)^t
Now with a formula, you can find lots of different information about your data, like when the water will run out, when certain amounts will be left, etc.
