Function: A rule that assigns to each domain exactly one range
|
If a graph is indeed a function, and each x-value corresponds to only one y-value, it will pass the vertical line test. This can be done by passing a vertical line over the graph of a function from right to left with the line only touching one point on the graph at a time. Similarly, if the same graph passes the horizontal line test, the inverse of that graph is a function as well. These are called one-to-one functions. |

|
|
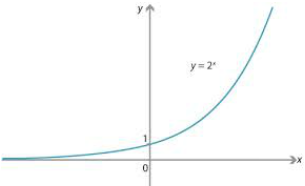
Some basic functions and their graphs:
Linear
f(x)=x Quadratic f(x)=x^2 Cubic f(x)=x^3 Exponential f(x)=2^x Logarithmic f(x)=lnx Sine f(x)=sinx Cosine f(x)=cosx Reciprocal f(x)=1/x Radical f(x)=sqrtx Absolute Value f(x)=|x| Step f(x)=[x] Logistic f(x)=1/1+e^-x |


|

Functions can be moved by altering their original equations. For example, if one wished to move the linear function f(x)=x up three units, the function's new equation would be f(x)=x+3. This is called a vertical shift. Other types of function alterations can be seen below.
f(x) -> -f(x) Vertical flip
f(x) -> f(-x) Horizontal flip
f(x) -> 2f(x) Vertical stretch by a factor of 2
f(x) -> f(2x) Horizontal stretch by a factor of 1/2
f(x) -> f(x)+3 Moves 3 up
f(x) -> f(x)-3 Moves 3 down
f(x) -> f(x-2) Moves 2 to the right
f(x) -> f(x+2) Moves 2 to the left
Problem Example: Move the general absolute value function f(x)=|x| down one unit and to the left two units.
f(x)=|x| Original
f(x)=|x+2| Moved left 2 units
f(x)=|x+2|-1 Moved down one unit
Compositions: Function compositions involve more than one function, an example being f(g(2)). If given the functions f(x)=2x-1 and
g(x)=3x, you would first plug 2 in for g(x), resulting in 6. Then, 6 would be plugged in for f(x), or 2(6)-1. Therefore, f(g(2))=11.
g(x)=3x, you would first plug 2 in for g(x), resulting in 6. Then, 6 would be plugged in for f(x), or 2(6)-1. Therefore, f(g(2))=11.
Domain: The domain of a function corresponds to the set of x-coordinates for that function. You can think of the domain as being all the numbers you can plug in for x while still getting a real number for your y value. For simpler functions such as f(x)=x, any number can be plugged in for x; there are no restrictions. That means that the domain for this function is x= all real numbers. However, some functions such as x/(x-2) have restrictions on their domain. If 2 were to be plugged in for x, the denominator of the function would be equal to zero, and the world would explode. As the denominator cannot be zero, 2 is not a possible x-value for this function. Therefore, the domain would be x≠2.
Problem example: Find the domain of the following functions.
a. f(x)= 2/(x+5) D: x≠-5
b. f(x)= sqrt(x-3) D:x≥3
c. f(x)= 3/(x+4)(x-1) D: x≠-4, x≠1
d. f(x)= log(x) D: x≥0
Problem example: Find the domain of the following functions.
a. f(x)= 2/(x+5) D: x≠-5
b. f(x)= sqrt(x-3) D:x≥3
c. f(x)= 3/(x+4)(x-1) D: x≠-4, x≠1
d. f(x)= log(x) D: x≥0
Range: As the domain of a function relates to its x-values, the range relates to its y-values. The range of a function covers the set of numbers that a function can result in, or its "output". For the function f(x)=x, the range, like the domain, would be all real numbers, because by plugging in any number, any number can be the y-value. An example of an equation with restrictions on the range could be f(x)=x^2. There will never be a negative solution to this function, so its range is R: y≥0.
X and Y intercepts: The x and y intercepts of a function are where its graph crosses the x and y axes, respectively. To find the x- intercepts of a function, plug in a zero for y, or f(x). For the y-intercepts, plug in the zero for the x. You do this because on the point where the graph crosses the x-axis (the x-intercept), the y coordinate will always equal zero. it is the same for the x on the y-intercept.
|
Continuity: If a function has no endpoints, then that function is continuous. If the function has an endpoint or a discontinuity, then that function is considered discontinuous, or not continuous. Some examples of discontinuities are shown below. A removable discontinuity occurs when a rational function has a same pair of parentheses in nits numerator and denominator, such as (x-2)/(x-2). This function would have a removable discontinuity at x=2

Continuous over the interval 
Jump discontinuity 
Removable discontinuity 
Infinite discontinuity Symmetry: When regarding functions, there are two types of symmetry- odd and even. Examples are given below.

Odd Symmetry
f(x)=-f(-x) 
Even Symmetry f(x)=f(-x) |
|
Inverse Functions: An inverse function is a function that "reverses" another. If a number x is plugged into an equation with the result being the number y, by plugging in y to its inverse function, you will get an x. The graphs of inverse functions reflect each other over the line y=x. To find the range of a function, one could find the domain of its inverse.
|
f(x)=x^2 f(x)=sqrtx
x y x y 1 1 1 1 2 4 4 2 3 9 9 3 4 16 16 4 |

|
|
Extrema: A local maximum of a function f is a value f(c) that is greater than or equal to all range values of f on some open interval containing c. If f(c) is greater than or equal to all range values of f, then f(c) is the maximum or absolute maximum value of f. A local minimum of a function f is a value f(c) that is less than or equal to all range values of f on some open interval containing c. if f(c) is less than or equal to all range values of f, then f(c) is the minimum or absolute minimum value of f. Local extrema are also called relative extrema.
Limit/ End Behavior: The limit of a function is a concept that looks at the end behavior of a function concerning a particular point, usually looking at infinity and negative infinity. The general notation for the limit of a function is shown below.


For example, take a look a the graph for the simple linear function f(x)=x. As the graph approaches infinity (in the right direction), it is forever increasing, or going up to infinity (up). Therefore, the limit as x approaches infinity of f(x)=x is infinity. However, as the graph approaches negative infinity, it is decreasing, or going down. This means the limit as x approaches -infinity of f(x)=x is -infinity.

Now look at the quadratic graph of f(x)=x^2. As x approaches infinity, it is increasing, so the limit is infinity. However, the negative side of this graph is above the x-axis, and the graph is also increasing on this side. For this function, the limit as x approaches -infinity of f(x)=x^2 is -infinity.

For the function f(x)=1/x the limit as x approaches infinity is 0, because as the graph moves farther in the positive direction (to the right), it get closer and closer to zero, rather than infinitely increasing or decreasing. The same goes for as x approaches -infinity. This function has an asymptote of x=0, so now we can look at the end behavior of this graph as it approaches 0. Trace the graph with your eyes from right to left as the curve on the right approaches the y-axis from the positive side. It is going up, forever increasing, so the limit as x approaches 0 from the positive side (denoted 0^+) of f(x)=1/x is infinity. Looking at the left half of the graph, the limit as x approaches 0 from the negative side (0^-) of f(x)=1/x is -infinity.
Problem Example: Find the domain, range, and intercepts and tell whether continuous, what kind of symmetry, and the end behavior of the following functions.
a. f(x)=x^3 D: x=all real numbers, R: y=all real numbers, (0,0), continuous, odd symmetry, limit as x approaches infinity of f(x) is infinity, limit as x approaches -infinity of f(x) is -infinity.
b. f(x)=(x+1)/(x-2)(x+1) D: x≠2, x≠-1, R: y≠0, (0,-0.5), removable discontinuity, limit as x approaches infinity of f(x) is 0, limit as x approaches -infinity of f(x) is 0, limit as x approaches 2^+ of f(x) is infinity, limit as x approaches 2^- of f(x) is -infinity.
Common core problems oftentimes apply math to real-life situations and can be solved in different ways doing different methods all with different steps. The following problem takes a look at a linear function modeling farm data. Finding regression lines and function information can all be done in different ways. Once you have a formula for your data, you can find lots of different information.
